반응형
빅데이터 모니터링을 오픈소스로 구성하기 위한 고민을 했습니다. 제가 경험한 모니터링 환경에서 클라우데라 제품을 사용하면서 봤던 모니터링이 편하긴 했습니다. 다만 클라우데라 매니저 자체가 유료로 바뀌게 되어 이제는 오픈소스소 사용할 수 없다는 단점이 생겼습니다.
아파치 하둡을 오픈소스로 모니터링 하기 위한 방법으로 키바나 구성도 고려를 했습니다만 키바나의 경우 다른 오픈소스와의 연동을 활발히 지원하지 않기때문에 최종적으로 Grafana Prometheus 조합을 선택하게 되었습니다.
Prometheus의 장점은 확장성 입니다. 오픈소스이다보니 다양한 exporter가 공개되어 있고 이를 적절히 찾아 사용하는 것으로 모니터링 환경 구성을 할 수 있다는 간편함이 있습니다. exporter 자체가 오픈소스이다보니 필요한 매트릭이 있다면 직접 추가해서 모니터링 할 수 있는 편리함도 있죠.
Prometheus의 기본 config파일을 다음과 같습니다.
# my global config
global:
scrape_interval: 15s # Set the scrape interval to every 15 seconds. Default is every 1 minute.
evaluation_interval: 15s # Evaluate rules every 15 seconds. The default is every 1 minute.
# scrape_timeout is set to the global default (10s).
# Alertmanager configuration
alerting:
alertmanagers:
- static_configs:
- targets:
# - alertmanager:9093
# Load rules once and periodically evaluate them according to the global 'evaluation_interval'.
rule_files:
# - "first_rules.yml"
# - "second_rules.yml"
# A scrape configuration containing exactly one endpoint to scrape:
# Here it's Prometheus itself.
scrape_configs:
# The job name is added as a label `job=<job_name>` to any timeseries scraped from this config.
- job_name: 'prometheus'
# metrics_path defaults to '/metrics'
# scheme defaults to 'http'.
static_configs:
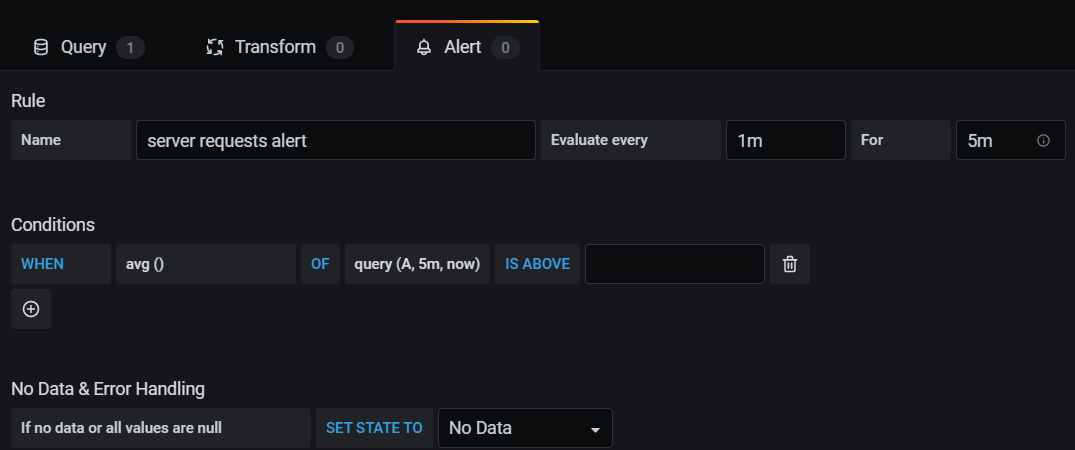
- targets: ['localhost:9090']알람 처리는 Grafana에서 하면 됩니다.
알람 처리를 할 수 있는 chart가 있으니 확인해서 선택 해야 합니다.
5분동안 지속된것을 1분마다 확인
반응형


